New State Ratings: AA(Red) and AA(Blue)?

This article was originally published on eBooleant.com. Join the over 700 investment professionals who viewed Dr. Fischer's post on this topic in his feed on Linkedin.
The bifurcation of the electorate comes through loud and clear—again. The election is sending a message about the economy as the rich states pull away from the rest. When the din of the pandemic is finally over, investors will have to deal with separation of the states.
The votes are (almost) all in and the country looks ever more bifurcated. In fact, it is. America continues to wreak havoc on yet another macroeconomic principle—“the iron law of income convergence.”[1]
The election results are a fundamental problem for the US and for economic theory. Simply stated, we are one country, and over time we should expect to be one economy. And following the Civil War in the 1860s that is what we saw. In fact, the convergence of the incomes of the American states was almost a truism for earlier generations of economists. And why not?
An economy in classical economics was thought to be a mixture of capital, labor, and technology. Where two economies had the same amount of capital, labor and technology but different incomes, shifts would force the marginal returns to the same level. And the great labor migrations from the south to the north or the east to the west in the US seemed to prove the result.
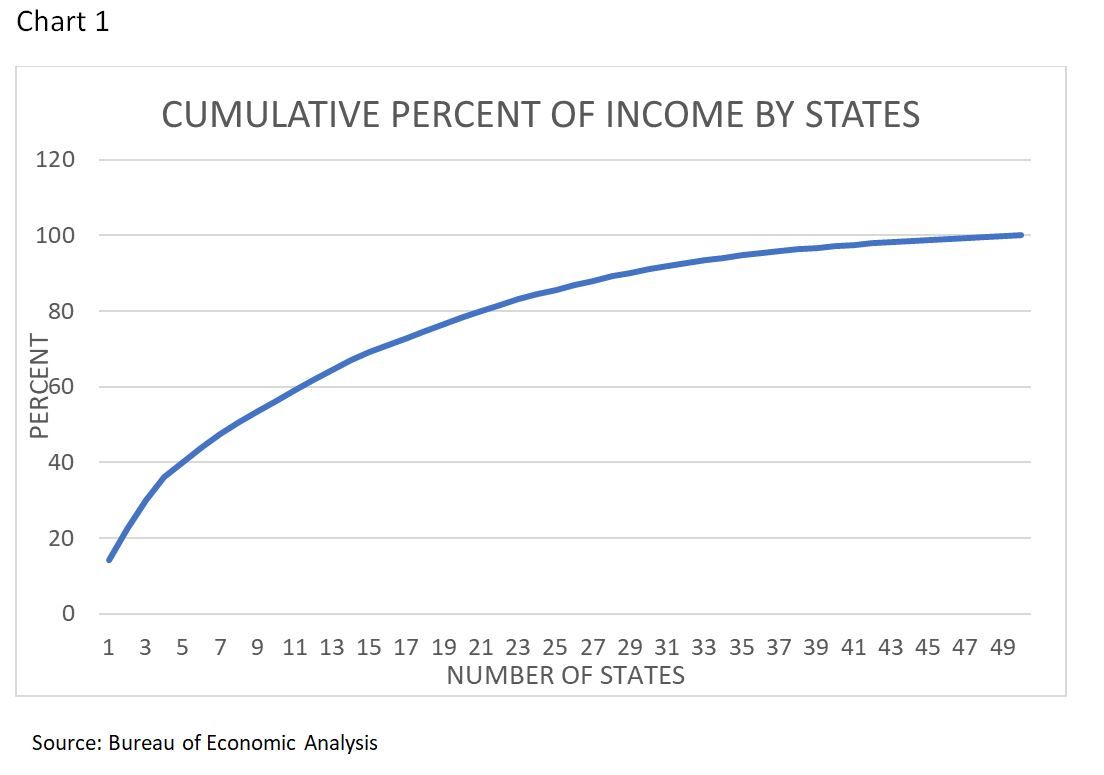
Until recently it was true. The states now are diverging in income.[2] There are a lot of ways to show that this is true. Individually, the large states have vastly more income than the one in fifty average would imply. Table 1 shows that California and Texas, for example, have multiples of the average value at 14.2% and 8.3%. The cumulative percent shown in Chart 1 show that the top eight states had over half of the per capita income in the country.
As the overall wealth of the country grows, so does the wealth of most of the states. In relative terms, however, the rich get richer. As we can see from Table 1, some states have far more than the average level of per capita income, implying that others have less.
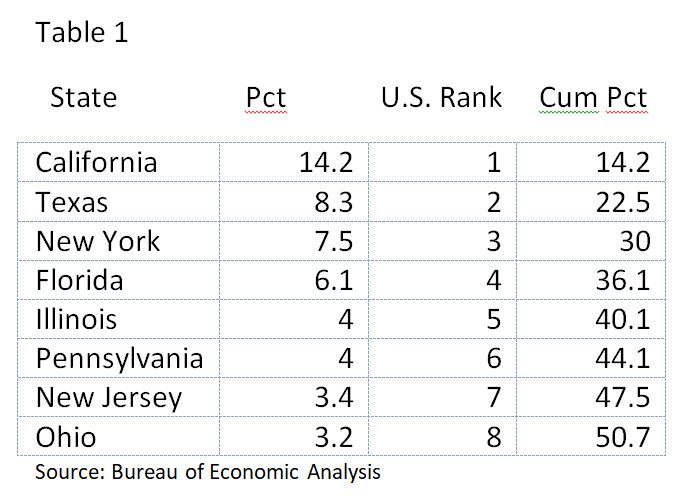
Chart 1 shows that most of the states add little to the country’s income.
Another way to view the data, without delving into a myriad of econometrics, is simply to look at the standard deviation of the relative state incomes. If all the states had 2% of the nation’s income, the standard deviations would be zero. Chart 2 shows that the actual standard deviation is in the 2-3 percent range.
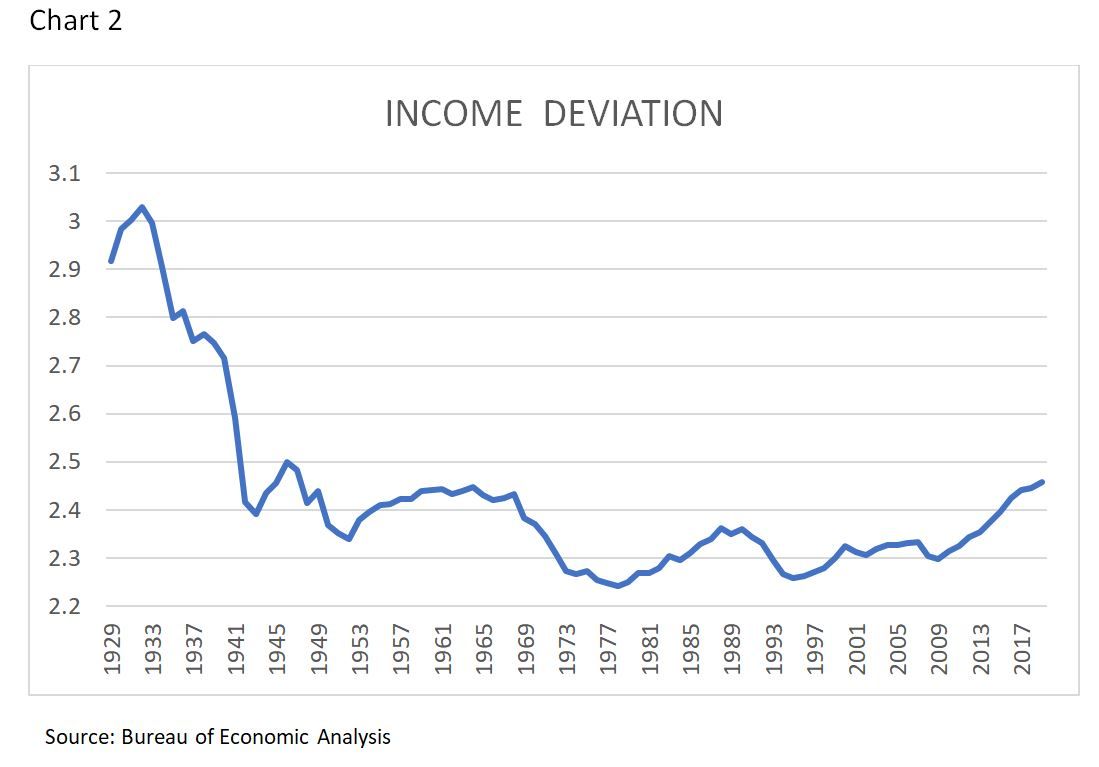
The volatility of the country’s income, as measured by these standard deviations, has broadly speaking had two phases. As the data shows, the state’s income volatility fell rapidly from the Depression Era in the 1930s to the 1970s. Then, at a slower rate, the volatility tended to increase. The increase has happened especially in the last decade from the Great Recession until now. This data is roughly consistent with the academic findings.[3] But the uptick in the Chart 2 for recent years strongly suggests that the states are diverging. These data are consistent with what I will call the “election barometer” we have seen in the bifurcated presidential election results. Nor does it suggest a quick end to the splitting as others have noted.
“… income divergence is likely to continue. Also, to the extent the recent prevalence of coronavirus might have affected the poorer states more, it is likely to accentuate income divergence across the states.”[4]
Two countries, two rating scales for munis?
The micro market structure of muni bonds reflects the regional economics of the issuers. The general rule for muni issuance is that projects are financed where the debt can be repaid, not just where the project is needed. The result is that muni issuance is concentrated in large wealthy states. The decline or reversal of income convergence means that bond issuance at least in the near term will continue to be concentrated in a few states. Call this USA (Blue)?
The states are headed toward different economies. State credit profiles already implicitly reflect that in their forward looking assessments. The states at this point largely differ economically by degree but given these trends it will soon be a matter of kind. This is happening internationally, too.[5]
Are we ready for AA(Red) and AA(Blue) ratings? To some degree we already have them. Get ready.
We hope you enjoyed this article. Please give us your feedback.
[1] Robert Barro, “THE ''IRON LAW OF CONVERGENCE'': New evidence on how fast poor countries can catch up with the advanced economies,” Royal Economic Society, June 16, 2015.
[2] Ganong P, Shoag D. Why Has Regional Income Convergence in the U.S. Declined?. Journal of Urban Economics [Internet]. 2017;102 :76-90. (See Figure 1, page 35).
[3] Ibid.
[4] Ram, R. Income convergence across the U.S. states: further evidence from new recent data. J Econ Finan (2020).
[5] Chander Kant, Income convergence and the catch-up index, The North American Journal of Economics and Finance, Volume 48, 2019, Pages 613-627, ISSN 1062-9408.