Unemployment Messages to the Cities

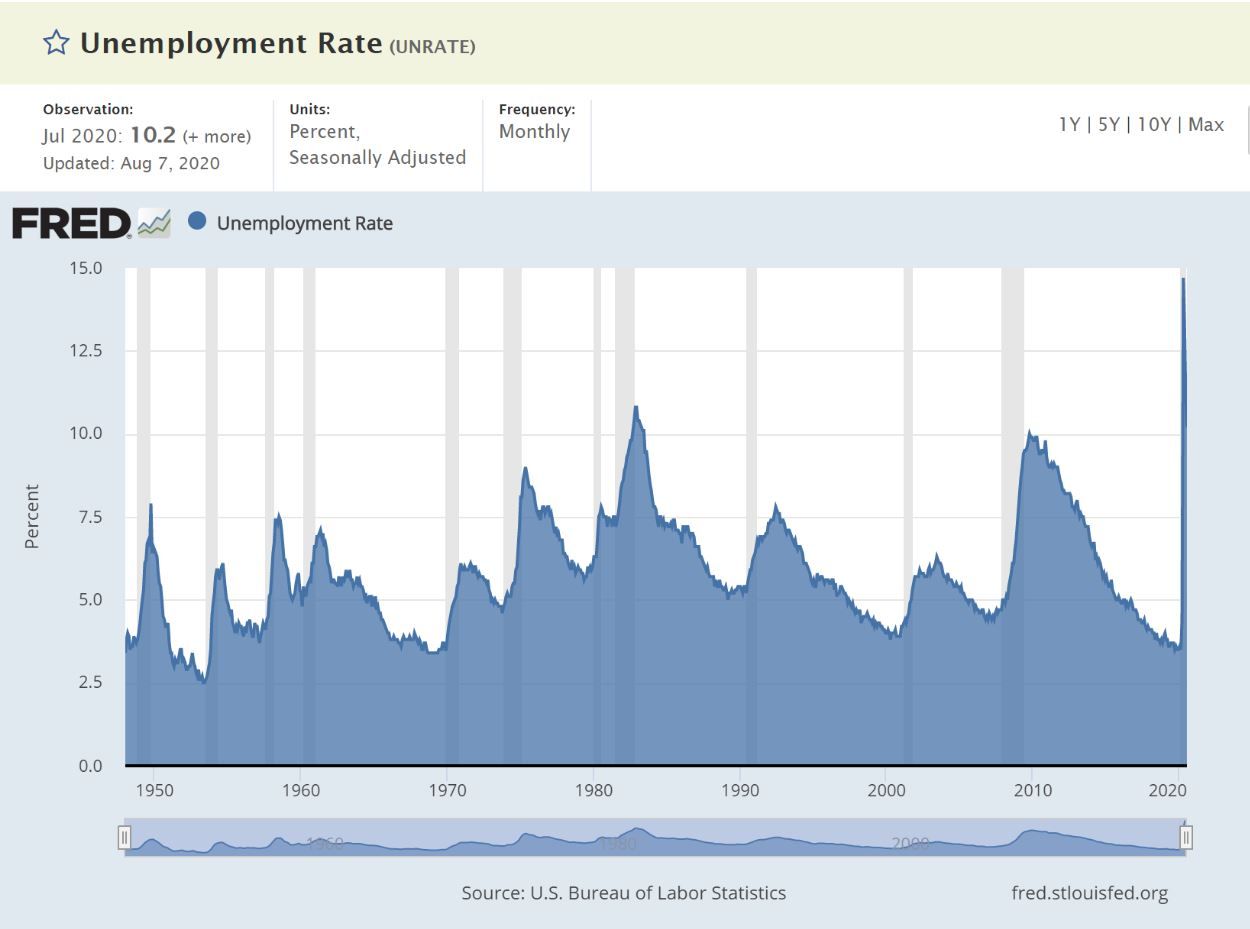
Each month the Bureau of Labor Statistics (BLS) collects data on 60,000 households to ascertain how many people 16 years old and older are actively looking for work but unable to find any. This is the U-3 unemployment rate and is the standard for the nation. It is widely criticized for its lack of breath, but in the time of COVID-19, it is good enough to signal the severity of the crisis.
Chart 1 from FRED shows that most Americans have never seen anything like this level of employment shock. Taken by itself, it justifies the extraordinary efforts of the Congress and the Fed to provide fiscal and monetary stimulus. Absent those efforts, U-3’s message is that we are headed to a deep recession.
Below the national level, however, U-3 also has clear credit implications, especially for local governments. A pandemic is uniquely a city crisis. And now the news is replete with stories of the flight of citizens from their cities, casting last year’s gentrification stories to the bins of ancient news. The stories are titled with action terms like “fleeing.”
Of course, almost all of the cities will survive, they always do, but there is clearly a price to be paid as well. And that price may be particularly high for cities this time.
A pandemic is a kind of disaster targeting cities and residents. Leaving a city during a plague is a long tradition for those mobile or those merely wealthy. For Americans, one of the best examples occurred when Philadelphia was the nation’s capital and a yellow fever epidemic hit. In 1793, half the population, even George Washington left the city. Alexander Hamilton, who himself got ill, left with his family.
Back then, Philadelphians took action to protect themselves, just as we do now. “They began keeping their distance from each other and avoided shaking hands. They cover their faces with handkerchiefs dipped in vinegar or smoked tobacco.”
The point is that cities have a long experience with pandemics. This one is not new, though, at least this time the doctors have stayed. The current stress in the cities is clear from the near silent daytime streets of Manhattan to the raucous nights of Portland, Oregon. The simple economics of the situation explain the tensions and serve to quantify them.
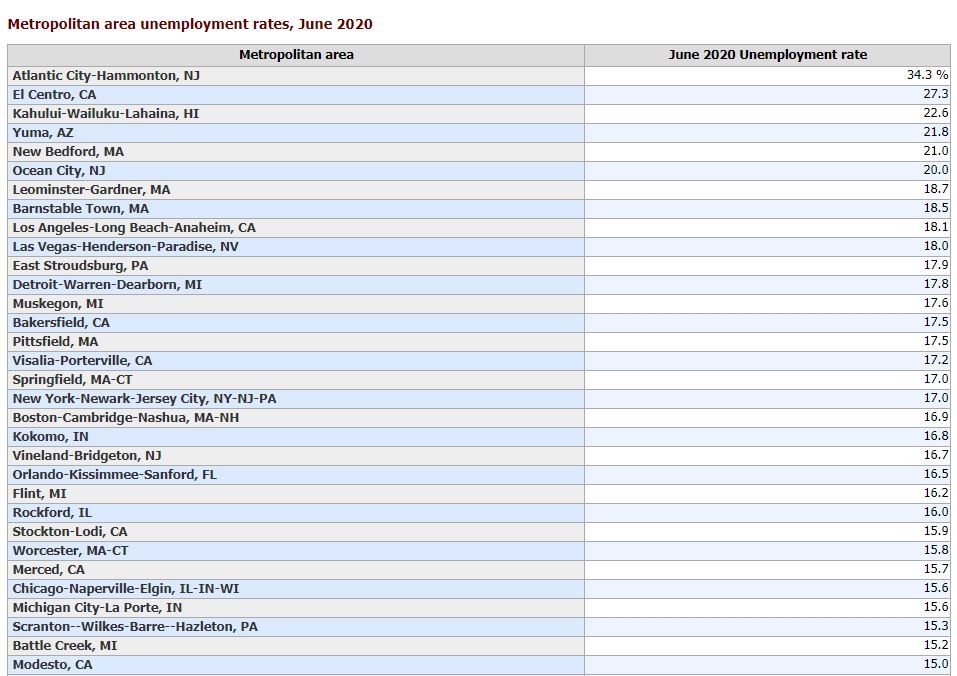
First, let’s note that by any reasonable standard, many major cities are in a depression. And these blanket the nation. Atlantic City-Hammonton, NJ presents a special case with over a third of its population unemployed. Indeed, were this to be a long-term phenomenon, it’s difficult to believe that an autonomous city can continue. Other cities in unemployment crises are shown in Table 1. While it is easy to dismiss the problems of many of these cities to long term demographic issues, we should realize that these level of unemployment data portend a very difficult life for millions of Americans.
Table 1
The city unemployment data shows relative as well as absolute levels. The pollical tensions between coastal cities and the rest of the nation seem exacerbated now. Indeed, the unemployment data suggests that this is a consistent reaction to the relative economics. Both the major cities and the rest of the nation face differential degrees of a difficult future. For some cities, however, the unemployment data suggests an even more dire situation.
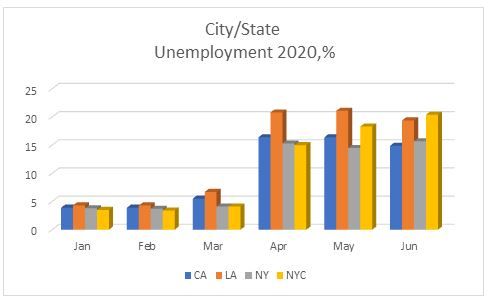
Chart 2 shows the absolute level of unemployment for two cases: California state and Los Angeles, as well as New York state and New York City. These two cities have unemployment rates well above their state’s. there are a wide array of unique conditions to point to in LA and New York but the other cities in the country have experienced most of them without the surge in relative unemployment. Here U-3 is pointing to severe downward population pressures for these cities
Chart 2
We hope you enjoyed this article. Please give us your feedback.